Volatility across markets
VF014 · Volatility forecasting · Lesson 4 of 15. Fifteen interactive steps, each with its own guided explanation.
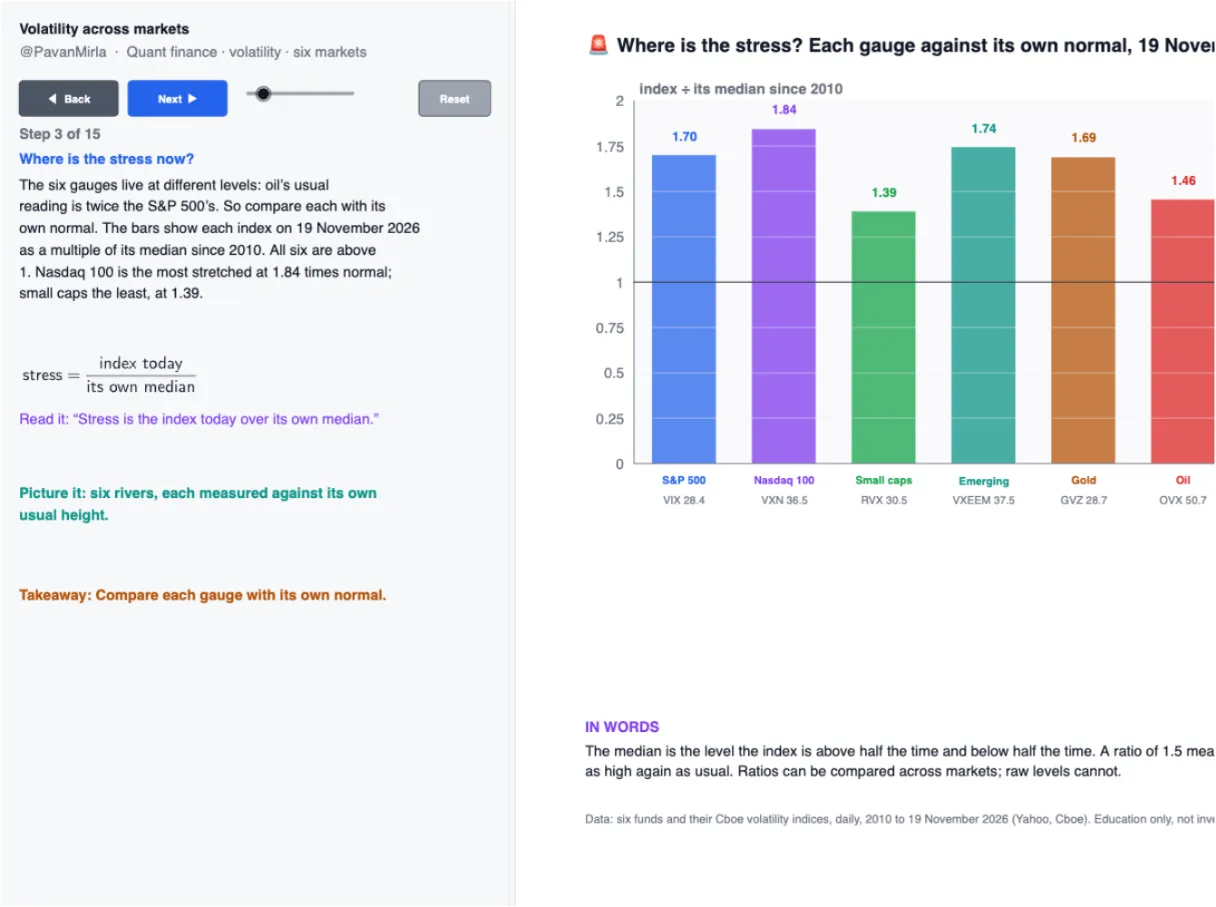
Six markets each have a fear gauge read from option prices. This lesson reads all six, compares them with their own history and with past scares, measures how much they overstate, and tests them as forecasts.
Every step uses real market data. This is education about models and their assumptions, not financial advice.
Explore next
Stories, illustrations, and interactive mini lessons. Ask a question.