Forecasting volatility
VF001 · Volatility forecasting and options · Lesson 1 of 8. Twelve interactive steps, each with its own guided explanation.
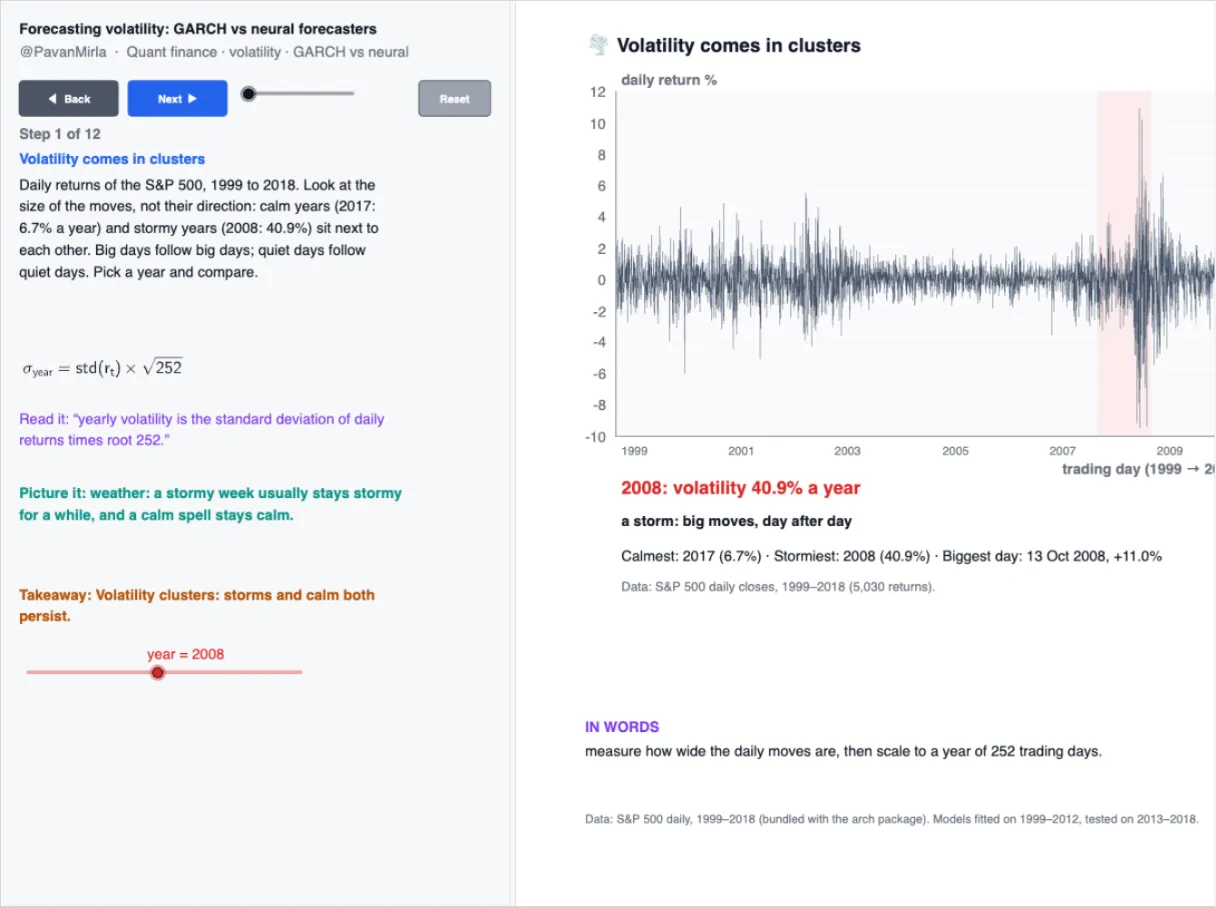
Twenty years of S&P 500 returns. Build GARCH(1,1) by hand, read its half-life, then race it against neural forecasters scored out of sample.
Every step uses real market data. This is education about models and their assumptions, not financial advice.
Explore next
- Volatility forecasting and options: the eight-lesson path
- Advanced Volatility Forecasting: Classical vs AI bootcamp
Stories, illustrations, and interactive mini lessons. Ask a question.