Bias, variance and overfitting
VF015 · Volatility forecasting · Lesson 11 of 15. Eleven interactive steps, each with its own guided explanation.
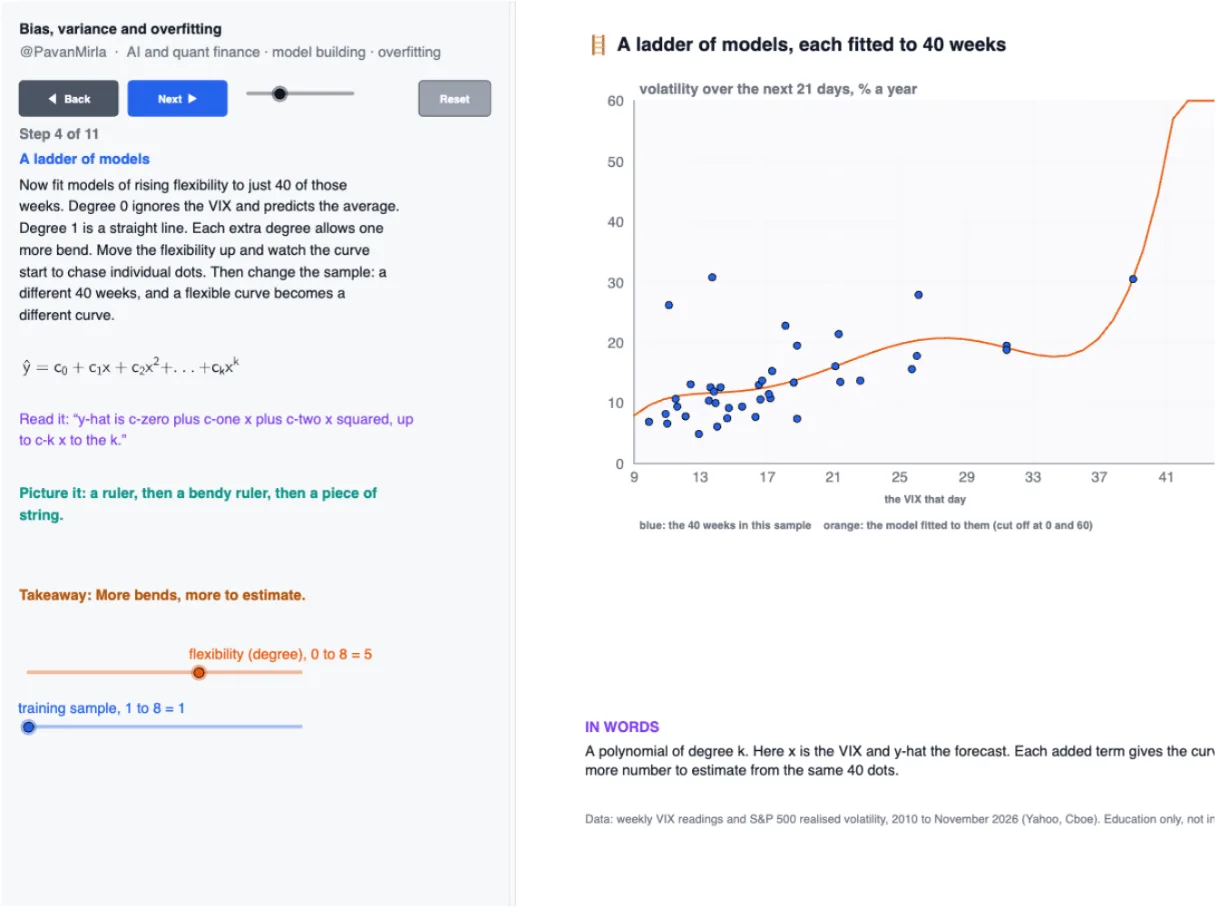
One real question, a ladder of models from very simple to very flexible, and a bullseye that shows the two ways a forecast can miss. Built on weekly VIX readings and the volatility that followed, 2010 to 2026.
Every step uses real market data. This is education about models and their assumptions, not financial advice.
Explore next
Stories, illustrations, and interactive mini lessons. Ask a question.