Curves + wiggles. Why does the average lift?
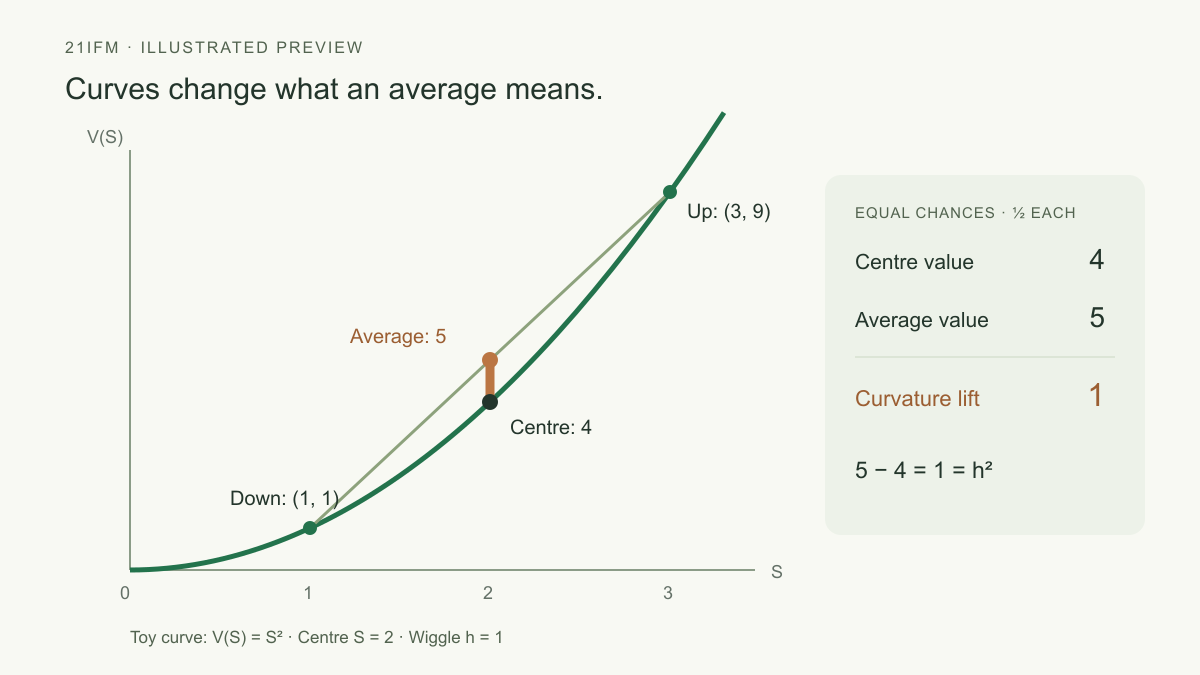
For the toy curve V(S) = S², two equally likely moves from S = 2 to 1 or 3 give values 1 and 9. Their average is 5, while the value at the mean stock level is 4.
Change the wiggle size in the interactive and compare the centre value, average value, and curvature lift. For the square curve the gap is exactly h². Predict, experiment, and try five questions with hints. Equal up and down moves cancel the slope contributions, while their squares add in the curvature contribution.
This finite two-outcome example motivates the curvature correction in Itô’s formula; it is not a proof of the continuous-time theorem or an actual option-pricing model. For dS = μ dt + b dW, the correction is ½ b² V_SS dt. With relative stock volatility σ, b = σS.
Explore next
Stories, illustrations, and interactive mini lessons. Ask a question.